
What 558,341 OnlyFans Profiles Reveal About Pricing, Content and Popularity
We analyzed pricing, activity, promotions and content across 558,341 active creator profiles. The relationships hidden in the data are much more interesting than any single average.
Published September 3, 2026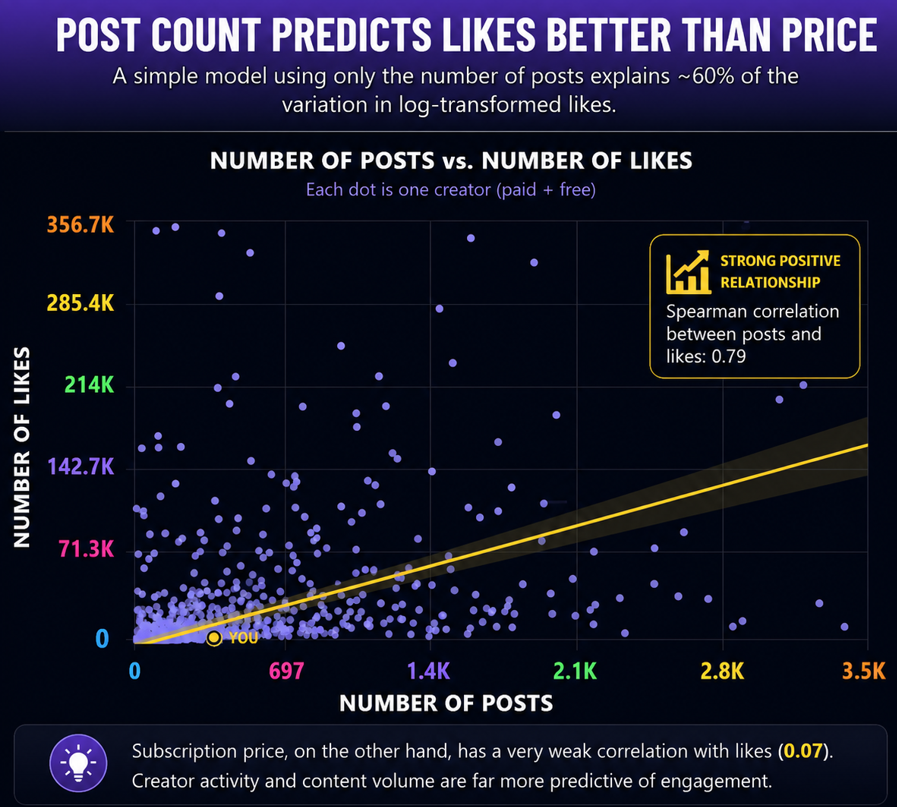
Most conversations about OnlyFans creators focus on the obvious questions: Who charges the most? Who posts the most? Which categories are most popular?
But when more than 558,000 creator profiles are normalized into a structured dataset and the variables are compared against one another, a different picture emerges. The surprising part is not any single statistic. It is the relationships hiding between them.
Important: These are observational correlations, not proof of causation. Account age, audience size and many other unobserved factors may influence the relationships described below.
The strongest predictor of likes is not price. It is activity.
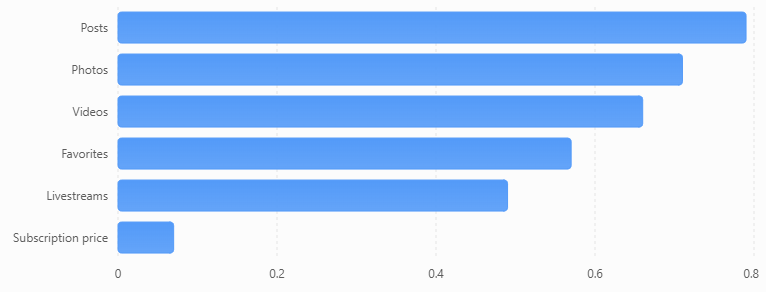
Among the numeric variables in the dataset, the clearest relationship with total likes is the creator's posting history. Using Spearman rank correlation, posts correlated with likes at approximately 0.79, photos at 0.71, videos at 0.66, favorites at 0.57, and livestreams at 0.49.
Subscription price, by comparison, had a Spearman correlation of only about 0.07 with total likes among paid creators. Knowing what a creator charges tells you remarkably little about accumulated engagement compared with knowing how active the account is.
A simple model using only the logarithm of post count explained roughly 60% of the variation in log-transformed likes. That does not mean posting more automatically produces popularity; established accounts have also had more time to accumulate both content and engagement. But the strength of the relationship is difficult to ignore.
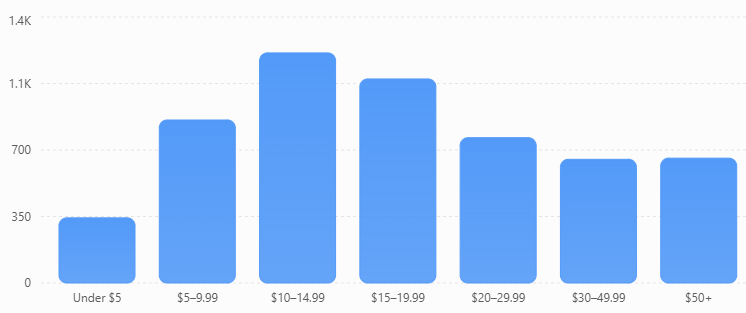
There appears to be a pricing sweet spot.
Price itself is not strongly correlated with popularity, but grouping paid creators by monthly price reveals a striking curve. Median likes were approximately 343 below $5, 858 from $5–9.99, 1,211 from $10–14.99, 1,074 from $15–19.99, 765 from $20–29.99, 651 from $30–49.99, and 657 at $50+.
The strongest median engagement appeared around the $10–15 range. The same pattern survived when likes were normalized by posting activity: median likes per post rose from about 5.9 below $5 to approximately 10.8 at $10–14.99 and 11.0 at $15–19.99 before declining again above $20.
That does not prove creators should charge $10–20. It may instead indicate that creators with strong demand naturally converge toward that range. Still, the data suggests the market may have developed an informal pricing equilibrium.
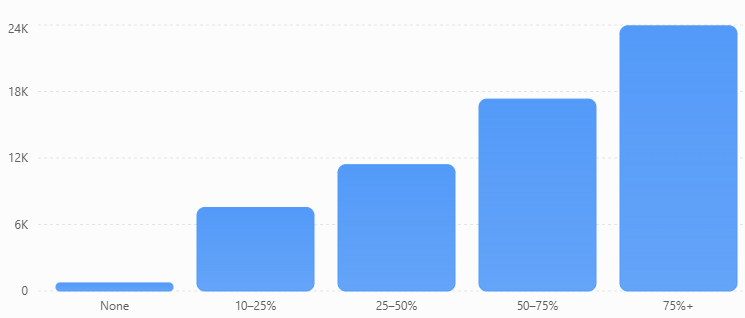
Discounts are associated with dramatically more established creators.
Among paid creators with no active discount, median likes were roughly 730. Creators offering 10–25% discounts had median likes of about 7,537; 25–50% discounts, 11,398; 50–75%, 17,316; and 75%+, 23,928.
The pattern remains visible even after accounting somewhat for posting volume. Median likes per post rose from approximately 8.6 with no discount to 20.8, 28.0, 40.6, and 67.6 across increasingly aggressive discount bands.
The tempting conclusion is that discounting creates engagement. The dataset cannot establish that. A more plausible interpretation is that successful, mature creators are more likely to use sophisticated promotional strategies. Discounting may be a marker of creator maturity rather than the cause of popularity.
Free trials may be an even stronger signal.
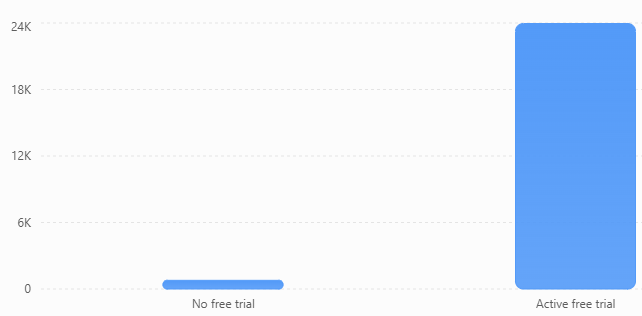
Only 4,718 profiles in the analyzed dataset had an active free trial, but those creators looked dramatically different from the rest of the population. Creators without a free trial had median likes of approximately 783. Creators with a free trial had median likes of 23,955 — more than 30 times higher.
Median likes per post were approximately 10.3 without a trial and 65.4 with a trial. Again, this does not prove free trials create the difference. It may instead indicate that creators with large existing audiences are disproportionately likely to use free trials as a customer-acquisition strategy.
The most successful creators may increasingly behave less like individuals posting content and more like subscription businesses using funnels, discounts and promotions.
A pinned post may be more meaningful than it looks.
Creators without pinned posts had median likes of approximately 449. Creators with pinned posts had median likes of approximately 3,046 — nearly seven times higher.
A pinned post obviously does not create popularity by itself. Instead, it may be a proxy for professional account management. A creator who deliberately manages what visitors see first may also be more likely to optimize pricing, promotions, messaging, posting cadence and conversion.
Saved livestreams reveal another high-engagement subgroup.
Creators with saved livestreams were relatively uncommon — just over 6,000 profiles — but the difference was substantial. Median likes were about 712 for creators without saved streams and 13,223 for creators with them.
Those creators also had much larger content libraries, with a median of roughly 549 posts. Even after accounting somewhat for posting volume, they still had more engagement per post. Livestreaming may therefore identify creators who have built deeper relationships with established audiences.
More video is not automatically better.
Creators were divided into quartiles based on the percentage of their media library made up of videos. Median likes were approximately 361 in the lowest video-share quartile, 1,230 in the low-middle group, 1,179 in the high-middle group, and 878 in the most video-heavy group.
The middle groups performed best. Rather than showing that video simply outperforms photos, the data suggests that a diversified content mix may outperform either extreme.
Content categories behave like ecosystems, not isolated tags.
Because TotallyFans normalizes creator content into standardized categories, we can examine how frequently categories occur together compared with the frequency expected if those tags were independent.
BDSM + Dom occurred together roughly 6.2 times more frequently than expected. JOI/Ratings + GFE appeared together around 3.5 times more frequently than chance expectation. One of the strongest relationships was Group + Hotwife/Cuckold, appearing together roughly 8.5 times more often than independence would predict.
The interesting lesson is not any individual pairing. Creator content forms clusters. That opens the door to recommendation systems that understand combinations of creator characteristics rather than simply matching one tag at a time.
Descriptive richness is itself associated with engagement.
Creators with no normalized adult-content tags had median likes of roughly 196. Creators with eight or more had median likes of approximately 2,757. Median likes per post also climbed from about 7.4 with no tags to 14.1 with eight or more.
Adding tags does not necessarily create engagement. More mature profiles may simply provide more public information to classify. Still, information density itself appears to be a measurable characteristic of more established creator accounts.
Free creators are not simply lower-performing paid creators.
Free profiles had fewer median total likes than paid creators — approximately 617 versus 886. But when engagement was normalized against post count, free creators had a higher median likes-per-post ratio: approximately 13.7 for free creators versus 9.4 for paid creators.
That distinction is easy to miss when looking only at aggregate totals. Paid creators tend to maintain larger content histories, while free creators may operate more like acquisition funnels that generate relatively high engagement from a smaller public content footprint.
The biggest hidden lesson: popularity is probably a system, not a single variable.
No single demographic, price or content category explains creator success. Instead, several characteristics repeatedly appear among highly engaged creators: large posting histories, diversified media libraries, promotional discounts, free trials, pinned posts, saved livestreams, richer content categorization and moderate rather than extreme subscription pricing.
That looks less like a single trick and more like an operating system. The strongest creators appear disproportionately likely to behave like professionally managed digital businesses. They publish, package, promote, create funnels, optimize what new visitors see and give fans multiple ways to engage.
Individual profiles tell stories. Large datasets reveal the system underneath them.
Methodology and limitations
Dataset: 558,341 active creator profiles • Published: September 3, 2026
This analysis uses publicly available creator profile information normalized into structured attributes in the TotallyFans CreatorSearch index. Some classifications are AI-assisted or inferred from available public profile information and are not necessarily creator self-reported.
Categories can overlap. Engagement metrics are cumulative and may reflect account age, audience size and other factors not controlled for in this descriptive analysis. Correlations should not be interpreted as causal effects.
TotallyFans does not estimate creator earnings or revenue in this report. TotallyFans is an independent creator discovery service and is not affiliated with OnlyFans.
Explore more TotallyFans research
Read the full research library or explore the structured creator categories behind the data.